D3 Scale
Published: May 28, 2019
Last updated: May 28, 2019
There is no denying the power of d3. You only have to look as far as the examples on their website to be overwhelmed by its flexibility and aesthetics.
Admittedly, the learning curve for d3.js can be as steep as they come for a JavaScript library. Luckily for us mere muggles, d3 has lightened the (bundle size) burden and can be equipped using the power of ES modules to become useful outside of d3.
d3-scale itself is an incredible library that can help us reduce code and normalise data to fit a particular domain and range for use anywhere in our code. Allow me to demonstrate this using three examples that make use of scaleLinear(), scaleThreshold() and scaleTime().
Before we get started
This blog post takes a few liberties, so I am assuming you are familiar with ES6 syntax and that you have setup an environment that supports ES6+. If you are ready, take a few deep breaths, strap yourself in and run npm i —save d3-scale.
Example 1: Embracing classification
Classification is used to categorise data. You’ve likely done it many times before. In the wild, I’ve recently used classification in code to designate status within a loyalty program, identify eligibility for bank loans and define a person’s tax bracket given a certain income.
Since relating to an example is important for learning uptake, I figure what could be more relatable than classifying school grades?
Putting on our thinking hats, we need to take the context of the situation to define what the domain and range will look like. For this example, we will assume that 50% means a pass, 65% a credit, 75% a distinction and 85% a high distinction - anything below means another semester at the school of hard knocks. This means that our domain should be an array that includes all the data values that correlate to its corresponding grade classification.
Knowing this, let’s begin by importing the scaleThreshold function from d3-scale and setting up two basic arrays.
import { scaleThreshold } from "d3-scale"; // we want the domain and range arrays to indicate a // value from 0 until 49 results in a fail, 50 to 64 // a pass etc. const domain = [50, 65, 75, 85]; const range = ["fail", "pass", "credit", "distinction", "high distinction"];
You may have noticed that our range has one more element than what is specified in the domain, why is that? As taken from the [online documentation](GitHub - d3/d3-scale: Encodings that map abstract data to visual representation.: "If the number of values in the scale’s domain is N, the number of values in the scale’s range must be N+1".
Now that we have defined our domain and range arrays with their corresponding breakpoints, let’s look at how we implement the function and create our scale.
const thScaleRamp = scaleThreshold().domain(domain).range(range);
Given the beauty of d3, setting up a domain and range will follow a similar pattern for each implementation of a scaling function.
But what actually happened? We just created a function variable that can be used to map an integer onto a range classification. Observe and see the magic unfold.
console.log(thScaleRamp(7)); // fail console.log(thScaleRamp(37)); // fail console.log(thScaleRamp(67)); // credit console.log(thScaleRamp(96)); // high distinction console.log(thScaleRamp(49)); // fail
If you want to see the full scale in action, run the following.
for (let i = 0; i < 100; i++) { console.log(`${i} - ${thScaleRamp(i)}`); }
Now is the time to classify all the things! What’s that? You know an alternative? You want to use a switch?
// No thanks data.map((d, i) => { let result; switch(true) { case (d<50): result = 'fail'; break; case (d<65): result = 'pass'; break; case (d<75): result = 'credit'; break; case (d<85): result = 'distinction'; break; case (d<100): result = 'high distinction'; break; default: result = 'unknown'; break; } console.log(`Student #${i} scored ${d}: ${result}`);
Note: Both thScaleRamp(-7) and thScaleRamp(107) are still valid using a threshold scale. While other d3 scales have a .clamp() method (you will see later), scaleThreshold does not. If you cannot ensure that the data from the source won’t fall outside of the domain, clean the data before running it through the scale.
Example 2: Embracing polylinearity
I may have flexed my writer’s license and made up a word. My quick Google search didn’t confirm its existence. Worry not - the power of adding prefixes to existing words will be justified! Instead of defining polylinearity now, let’s explore some examples to demonstrate what a polylinear scale is.
Let’s begin small: scaling linearly. Assume we have started a company and to complete phase one of our funding, we are looking at a target of raising \$5000.
Assuming we wish to generate a simple progress report that will take some data within a domain, scale it and output it within a basic range, we could use the scaleLinear() function, take what we know from our previous example and conjure this up.
import { scaleLinear } from "d3-scale"; const lScaleRamp = scaleLinear().domain([0, 5000]).range([0, 100]); console.log(lScaleRamp(0)); // 0 console.log(lScaleRamp(2500)); // 50 console.log(lScaleRamp(5000)); // 100
What do you mean you’re not impressed? I can hear it now. "You can do just some basic math if you want to scale it as a percentage."
Alas, you are correct so far. Let’s create a random data array this time and see what happens.
data = []; // randomly generate a number within the // domain and add it to the data array for (let i = 0; i < 20; i++) { data.push(Math.floor(Math.random() * 5000)); } data.map((d) => { // These come out the same console.log(`Linear scale - ${d}: ${lScaleRamp(d)}`); console.log(`Basic math - ${d}: ${(d / 5000) * 100}`); });
Well fine, you’re not impressed... but what happens if we want to see our progress across four rounds of fundraisers?
Let’s define that we consider phase one completed after raising our capital to $5000, phase two completed after reaching $50000, three at $500000 and the final phase at $5000000. How can represent the total progress completion along the phases combined in the one report?
Well, why not just adjust our domain on the current scale?
const lScaleRampAdjusted = scaleLinear().domain([0, 5000000]).range([0, 100]); console.log(lScaleRampAdjusted(5000)); // 0.1 console.log(lScaleRampAdjusted(50000)); // 1 console.log(lScaleRampAdjusted(500000)); // 10 console.log(lScaleRampAdjusted(5000000)); // 100


Linear scale
As you can see, completing phase one only equates to 0.1% completion. Maybe this isn’t the best report we want to reflect our four phase business plan. Enter polylinear scaling.
Let’s create a scale now that denotes all of the important phase data points.
const pScaleRamp = scaleLinear() .domain([0, 5000, 50000, 500000, 5000000]) .range([0, 25, 50, 75, 100]);
With the domain and range arrays that we have used, we are telling d3 to map anything between 0 - 5000 to a value between 0 - 25, anything between 5000 - 50000 mapped to 25 - 50 and so on.
Let’s generate some data and log out the results!
data = [4000, 5000, 25000, 50000, 60000, 400000, 1200000]; data.map((d) => console.log(`Poly scale ${d}: ${pScaleRamp(d)}`)); // Output values respectively // Poly scale 4000: 20 // Poly scale 5000: 25 // Poly scale 25000: 36.111111111111114 // Poly scale 50000: 50 // Poly scale 60000: 50.55555555555556 // Poly scale 400000: 69.44444444444444 // Poly scale 1200000: 78.88888888888889
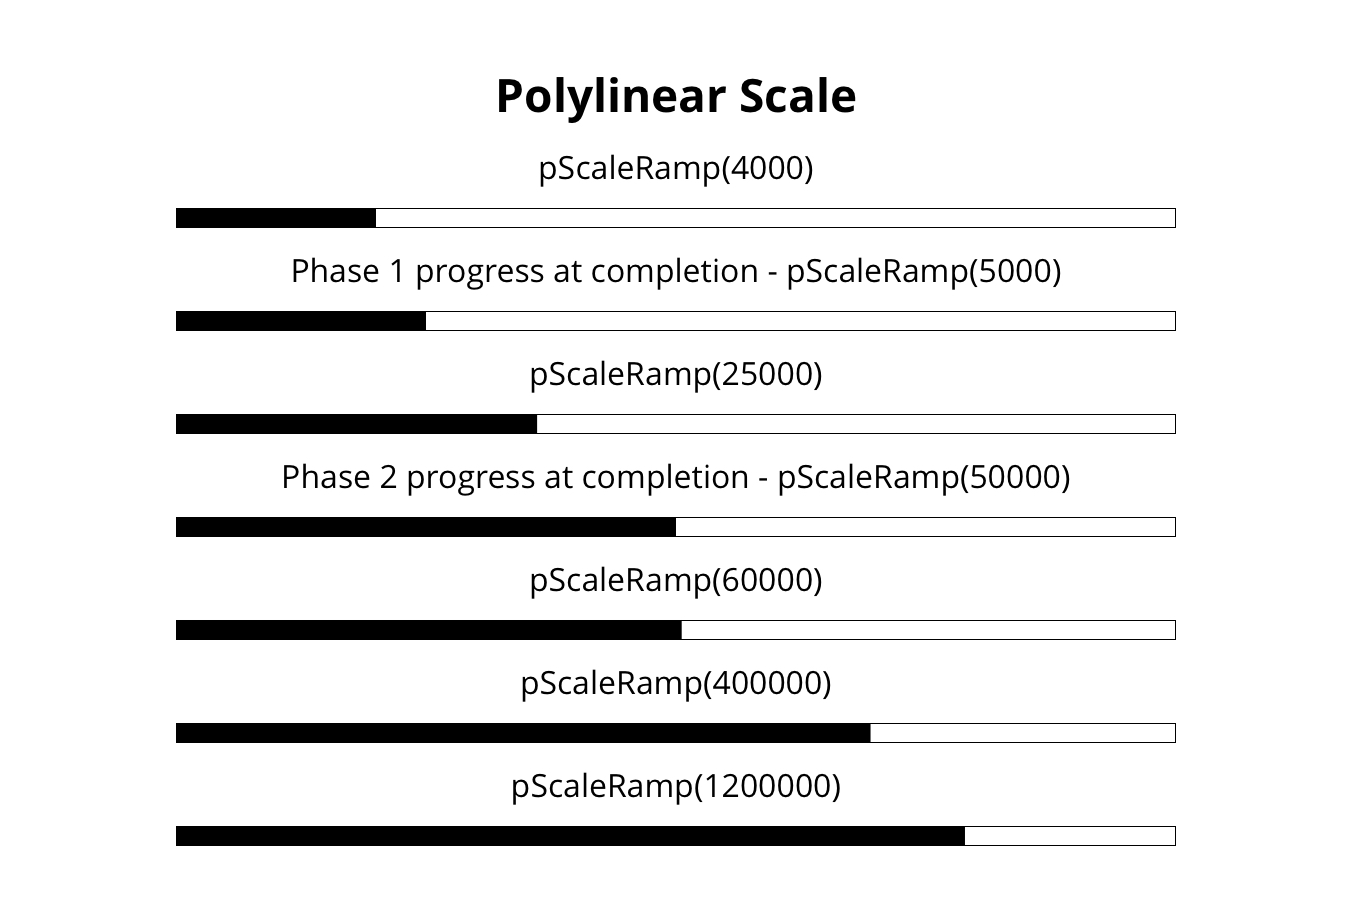
Polylinear Scale
That is definitely a better representation of progress for where we sit along our four phase business plan! Included in the above data set are both 5000 and 50000 to demonstrate that hitting those figures corresponds to a completion point at 25% and 50% - meaning that both phase one and phase one of the four total phases have reached completion!
Example 3: Embracing the space-time continuum
Maybe not that far. That being said, showing dates along a timeline using d3-scale itself doesn’t need to sound so daunting.
Let’s keep running with the idea of a timeline. For this example, we want to show a timeline of our raging Fortune 500 company, "Llama with Hats". Correct. Singular Llama. Many hats.
Let’s presume our company started on September 14th, 2013 and the latest major milestone we want to include is the release of our incredible tech cross-species innovation the Llama Phone on December 7th ,2018 (don’t take my idea).
In between, we also celebrated a few other key achievements as assigned to our timestamps variable.
const timestamps = [ "Sat Sep 14 2013 00:00 GMT-0800 (PST)", "Mon Dec 15 2014 00:00 GMT-0800 (PST)", "Fri Jan 09 2015 00:00 GMT-0800 (PST)", "Sun Jan 01 2017 00:00 GMT-0800 (PST)", "Fri Dec 07 2018 00:00 GMT-0800 (PST)", ];
Given the current format of the data given to use, we can make use of Array’s prototype function .map() to create the dates array that we actually want.
const dates = timestamps.map((d) => new Date(d)); // Logging out to the console will give you useable dates console.log(dates); // 0: Sat Sep 14 2013 18:00:00 GMT+1000 (AEST) {} // 1: Mon Dec 15 2014 18:00:00 GMT+1000 (AEST) {} // 2: Fri Jan 09 2015 18:00:00 GMT+1000 (AEST) {} // 3: Sun Jan 01 2017 18:00:00 GMT+1000 (AEST) {} // 4: Fri Dec 07 2018 18:00:00 GMT+1000 (AEST) {}
This time, the scaling function we are looking for our newest friend scaleTime. By this stage of the tutorial, you could probably guess how we assign our scaling variable.
// Ahhh, the beauty of consistent method naming strikes again const tScaleRamp = scaleTime() .domain([dates[0], dates[dates.length - 1]]) // refer to notes at the end for this domain assignment .range([0, 100]);
Now that we have our scaling variable, all that is left to do is run the elements of our dates array through it!
dates.map((d) => console.log(tScaleRamp(d))); // Output values respectively // 0 // 23.926701570680628 // 25.23560209424084 // 63.089005235602095 // 100

Time scale
And there you have it. Mapping points along a progress bar was once daunting, yet is now be a feeble percentage we can use to displace our marker in along the range.
Note: Setting your domain using the above is a really bad idea and is used simply for demonstration purposes. Another d3 library (d3-array)[GitHub - d3/d3-array: Array manipulation, ordering, searching, summarizing, etc. has an excellent array function extent that returns the min and max of an array as an array and can passed as the argument for domain() . I’ve passed on it given I wish to focus only on d3-scale in this post.
Summary
d3 is home to many JavaScript gems, and scaleThreshold(), scaleLinear() and scaleTime() are but a small part of the d3 ecosystem. Given the malleability of the d3-scale module, it allows those who are unfamiliar with d3 the ability to still utilise these wonderful functions in abstract, useful ways with our own code.


Dennis O'Keeffe
Melbourne, Australia
1,200+ PEOPLE ALREADY JOINED ❤️️
Get fresh posts + news direct to your inbox.
No spam. We only send you relevant content.
D3 Scale
Introduction
