A First Look At Generative Art With p5.js
I have recently begun redecorating my room and a recent addition was a new set of frames. While the frames are nice, I am not the greatest fan of the default prints that have come with it! After struggling to find adequate prints of the desired size, I have come to the conclusion that I may as well use this as an opportunity to explore generative art and create some stills to print on my wall in the interim (until I find my desired prints).
In today's tutorial, we are going to explore p5.js and slowly explore a generated sinusoidal wave to see how we can begin to express the inner artist we never knew we had.
Getting Started
For today's tutorial, we are actually going to explore the changing results using the online playground. Doing so will enable us to add changes as we go and explore together.
The introduction code we get is this:
function setup() { createCanvas(600, 600); } function draw() { background(0); for (x = 0; x <= mouseX; x += 30) { for (y = 0; y <= mouseY; y += 30) { ellipse(x, y, 20, 20); } ellipse(x, y, 20, 20); } }
The setup and draw function are essentially our two main methods we need to work with. setup is called at the start of the lifecycle and draw is called on the tick of every frame. These are important concepts to grab early in the piece, but will become more clear as we begin to add more and more to it.
Pressing play on the top left-hand side enables us to see the output.

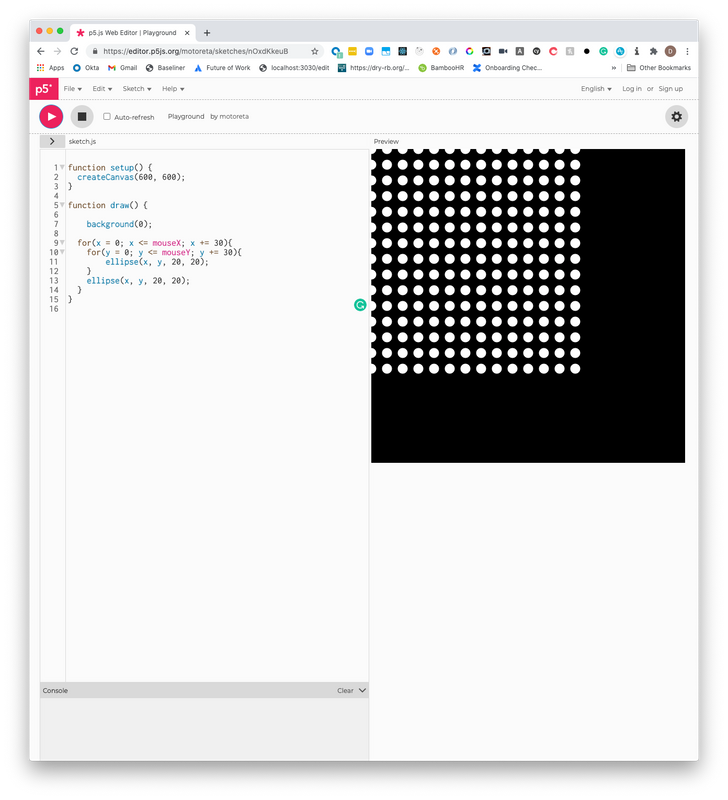
Initial input
In the above with the default code, it instructs the library to create a 600 by 600 canvas in the DOM during the setup, and then during the repeating draw phase that is called on each tick of the frame, the mouse point is found and ellispses are drawn until it reaches mouseX and mouseY (which is provided by the library during the draw phase).
Hopefully you are with me so far, but do not fret. We are going to reset the setup and draw functions to go from the basics and refer to documentation.
Setting up a basic Sinusoidal Wave
Update the code to show the following:
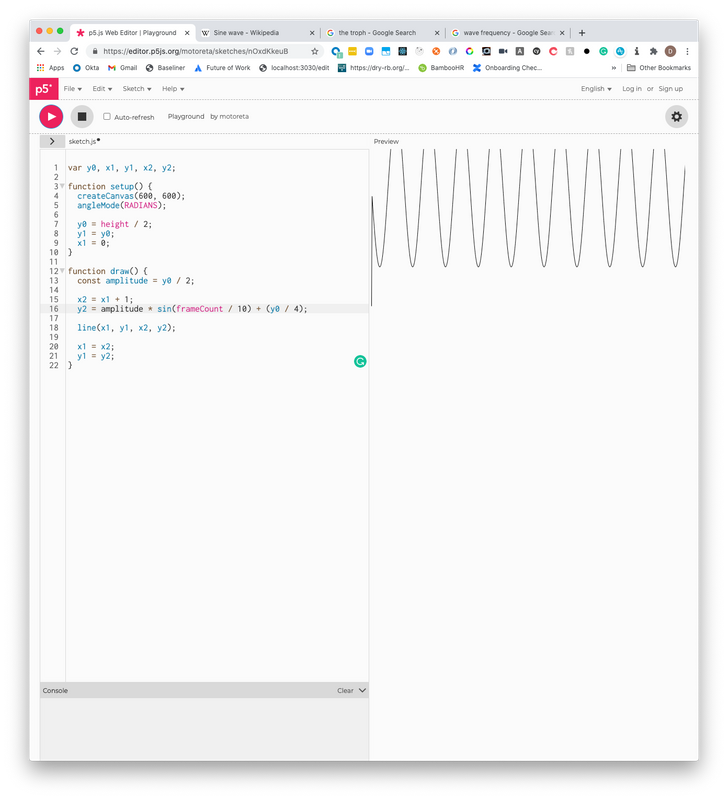
// initialise the variables var y0, x1, y1, x2, y2; function setup() { createCanvas(600, 600); angleMode(RADIANS); // set the base of y to be half te size of the canvas y0 = height / 2; // set the first value of y1 to start at the midway point y1 = y0; // tell x axis to start at left side of the canvas x1 = 0; } function draw() { // this sets our wave to be half the size of the height (+150 up and -150 down) const amplitude = y0 / 2; // on each frame, let's add 1 to the last x1 value x2 = x1 + 1; // multiple amplitude by the sin calc output and offset it to the midway point y2 = amplitude * sin(frameCount / 10) + y0; // draw a line from the last known point to the new one line(x1, y1, x2, y2); // update x1, y1 to be the last known point for the next iteration x1 = x2; y1 = y2; }
The comments should explain some of the icky math, but in the general we can create a wave over time by drawing a line from the last known (x, y) coordinates and connecting it to the newly calculated ones which is done over each frame.
The frameCount variable will give us the current frame (and comes as part of the library). This value starts from 0 and goes in a positive direction, so we can use it to change the frequency ie space between each "cycle" of a sine wave (peak + trough).
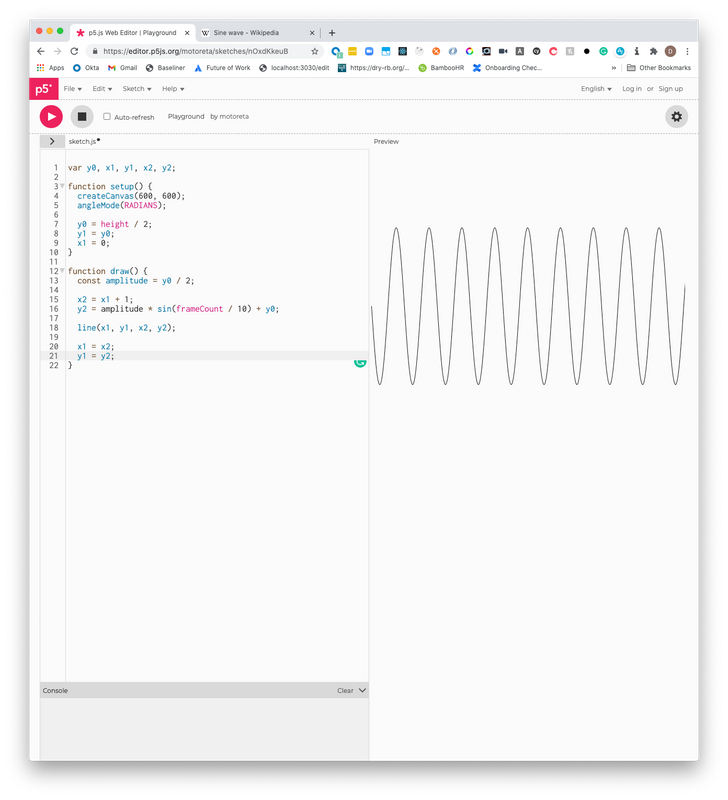
Sinusoidal wave
From here alone, it is worth change the amplitude value and change the value of 10 in sin(frameCount / 10) as well as the offset y0 to get a better visual understanding of what is happening.
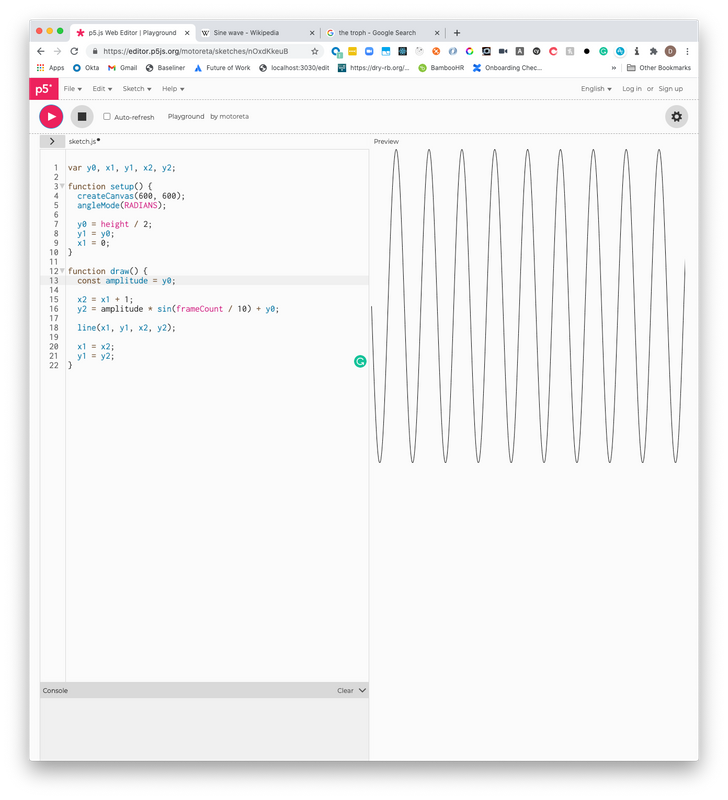
Changing the amplitude
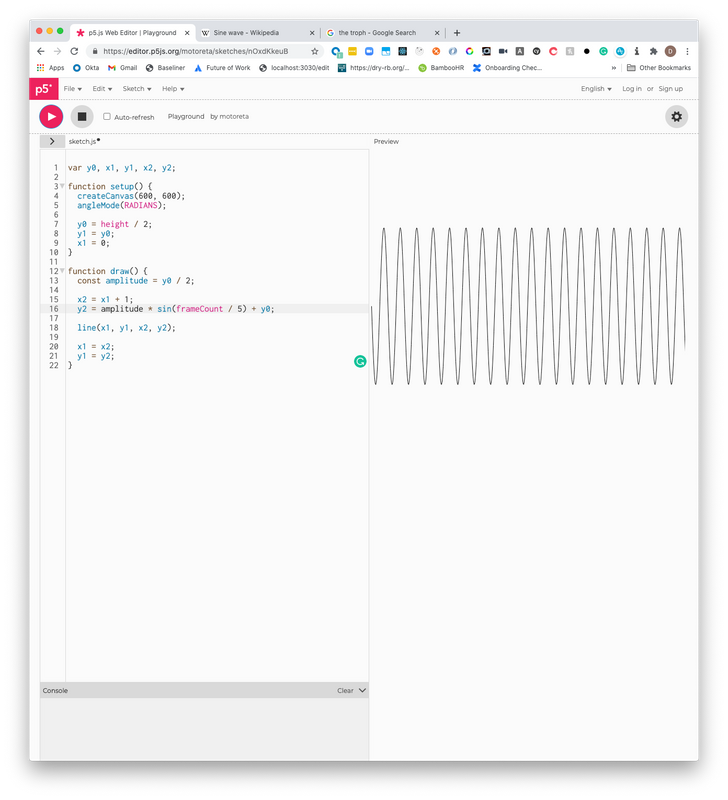
Changing the frequency
Changing the offset
Changing the stroke color and amplitude dynamically
Now, we are going to make some changes that may be hard to understand at first. We want to:
- Stop the loops (from the setup function).
- Draw all the lines at once (requiring an array of values to loop on the only call to draw).
- Change the amplitude over time.
- Change the stroke color over time.
To do so, we add the following code:
var y0, x1, y1, x2, y2; function setup() { createCanvas(600, 600); angleMode(RADIANS); noLoop(); y0 = []; x1 = []; y1 = []; x2 = []; y2 = []; } function draw() { for (let i = 0; i < 600; i++) { y0[i] = height / 2; if (i === 0) { y1[i] = y0; x1[i] = 0; } else { y1[i] = y1[i - 1]; x1[i] = x1[i - 1]; } stroke(`rgba(0, 0, 0, ${(1 / width) * (width - x1[i])})`); const amplitude = i / 10; x2[i] = x1[i] + 1; y2[i] = amplitude * sin(i / 10) + y0[i]; line(x1[i], y1[i], x2[i], y2[i]); x1[i] = x2[i]; y1[i] = y2[i]; } }
We use the noLoop function in the setup to ensure there is only one call to draw, but now we must also update draw in order to loop over the width of our canvas and draw a sinusoidal wave.
We are going to use the loop i value to help us also dynamically change the stroke alpha as well as the amplitude. The resulting wave it this:
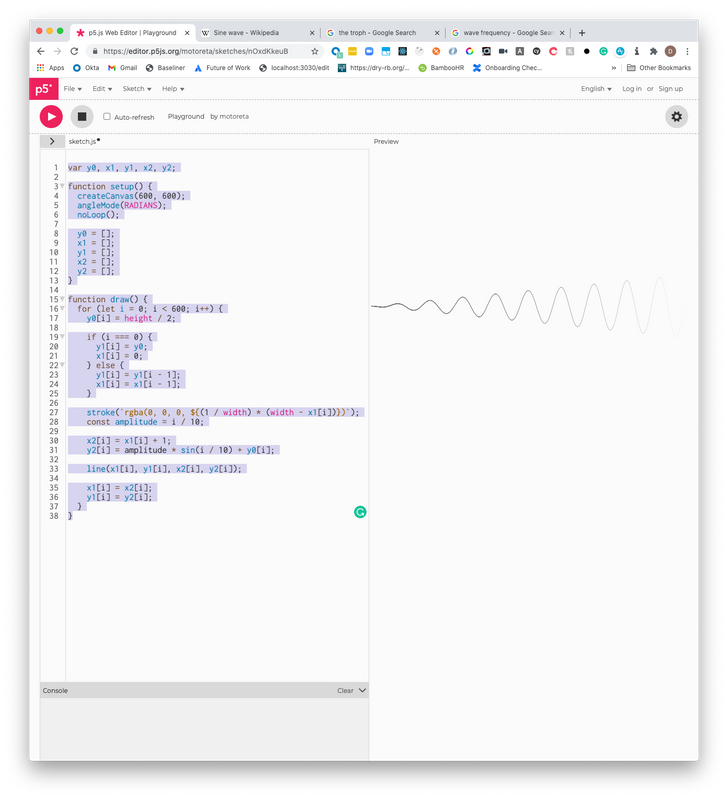
Dynamic, squiggly sine wave
Drawing multiple lines with slight changes
Now we can start generating the fun stuff. In this example, we are still going to keep the noLoop (ultimately my goal is to draw some abstract art). However, what we will do is abstract what we have in the draw function to its own helper function drawSineWave and then iterate over that 50 times to draw 50 waves!
In order to stop it from drawing all the same wave, we will again use the power of the loop to pass a modifier argument which can be used as an offset.
var y0, x1, y1, x2, y2; function setup() { createCanvas(720, 600); angleMode(RADIANS); noLoop(); y0 = []; x1 = []; y1 = []; x2 = []; y2 = []; } function draw() { // draw 50 sinusoidal waves for (let i = 1; i < 50; i++) { drawSineWave(i); } } function drawSineWave(modifier) { for (let i = 0; i <= width; i++) { y0[i] = height / 2; if (i === 0) { y1[i] = y0; // slighly displace each wave x1[i] = 0 + modifier; } else { y1[i] = y1[i - 1]; x1[i] = x1[i - 1]; } stroke(`rgba(0, 0, 0, ${((1 / width) * (width - x1[i] / 2)) / 5})`); const amplitude = (i / 10) * (modifier / 20); x2[i] = x1[i] + 1; y2[i] = amplitude * sin(i / 10) + y0[i]; line(x1[i], y1[i], x2[i], y2[i]); x1[i] = x2[i]; y1[i] = y2[i]; } }
The result is something cooler like this:
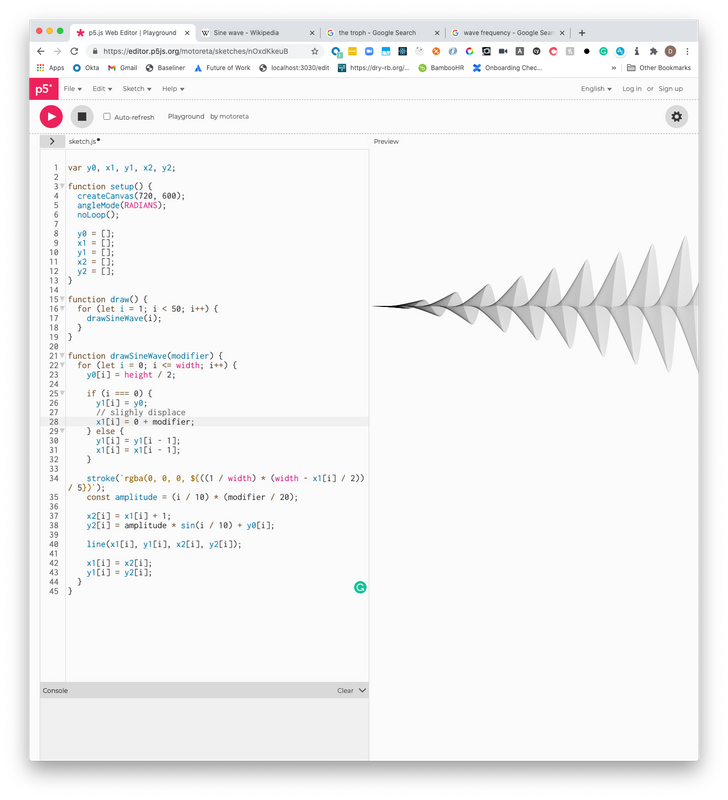
Multiple sinusoidal waves
Summary
In conclusion, we just took a small look into using the p5.js library to begin drawing some generative art.
This is day one for me, so I am certainly no expert, but it should be a good enough launch pad for you to start playing around with some of your own modifiers and get things going.
My plan is to continue exploring the library over the next few weeks and continue writing some posts, so hopefully by the end I will have some worthy prints to use as placeholders across my bedroom.
Resources and further reading
Image credit: Alexander Ant


Dennis O'Keeffe
Melbourne, Australia
1,200+ PEOPLE ALREADY JOINED ❤️️
Get fresh posts + news direct to your inbox.
No spam. We only send you relevant content.
A First Look At Generative Art With p5.js
Introduction
