Exploring Vercel Analytics Using Next.js 10 and GTMetrix
Published: Nov 6, 2020
Last updated: Nov 6, 2020
Vercel announced their new analytics feature during their recent Next.js conference and great news to all - it is live to try right now.
In my most recent post, I deployed a simple Next.js 10 application to Vercel. Now is the time to test out some of their new features!
In this post, we will cover how to enable Vercel Analytics on a Vercel hosted Next.js 10 project, then use GTMetrix to help send some request from around the globe (using throttling for various speeds) that our analytics can collect (on top of any other potential visits to the site).
The "what" of Vercel Analytics
A great way to understand what is on offer is to read through Vercel's analytics overview.
It covers things such as pricing, what you get per tier, what frameworks are supported (Next.js 10+, Gatsby 2+) and an overview of each of the metrics that you get and the "why" those metrics are so important to modern web development.
While I will not cover what is in the above overview, I will be exploring some of the data points being ingested and calculated.
Enabling Vercel Analytics
This assumes you have a Next.js 10 project currently hosted on Vercel. If you do not but would like to do so, follow my recent post to upload a basic site.
Once that is done, head to your Vercel dashboard and select the project you would like to enable analytics on. I chose the project directly from my previous blog post.
Once on the project page, select Analytics from the top row and you will be greeted with a Enable analytics button. Don't worry if you're on the free tier; the overview informs us that on the hobby tier, you are eligible to 1-day retention, 100 maximum data points per day with 100% sample rate.
Note: On the Hobby plan, Analytics can only be enabled on a single Vercel project. Feel free to disable after the tutorial.
Once you are on the analytics tab, you will be greeted with the following modal:


Enable Vercel Analytics
Select Enable, and then Vercel will prompt you to redeploy with your build with analytics enabled. Once, that is done, Vercel will kindly let you know that it is awaiting data:

Awaiting data on Vercel Analytics
Playing around with GTMetrix
GTMetrix describe themselves as the following:
"GTmetrix is a free tool that analyzes your page's speed performance"
Something very cool with GTMetrix is that you can use the website to make requests from different locations on different browsers with different speed emulations (think very fast broadband, 2g, etc).
This is great for yourself to test against your own websites, but it is also a great way for us to start creating some data points for Vercel to report back to us!
Note: the metrics returned from GTMetrix and Vercel Analytics measure different things. See more on the Vercel overview resource linked to see what Vercel measures and why that is important.
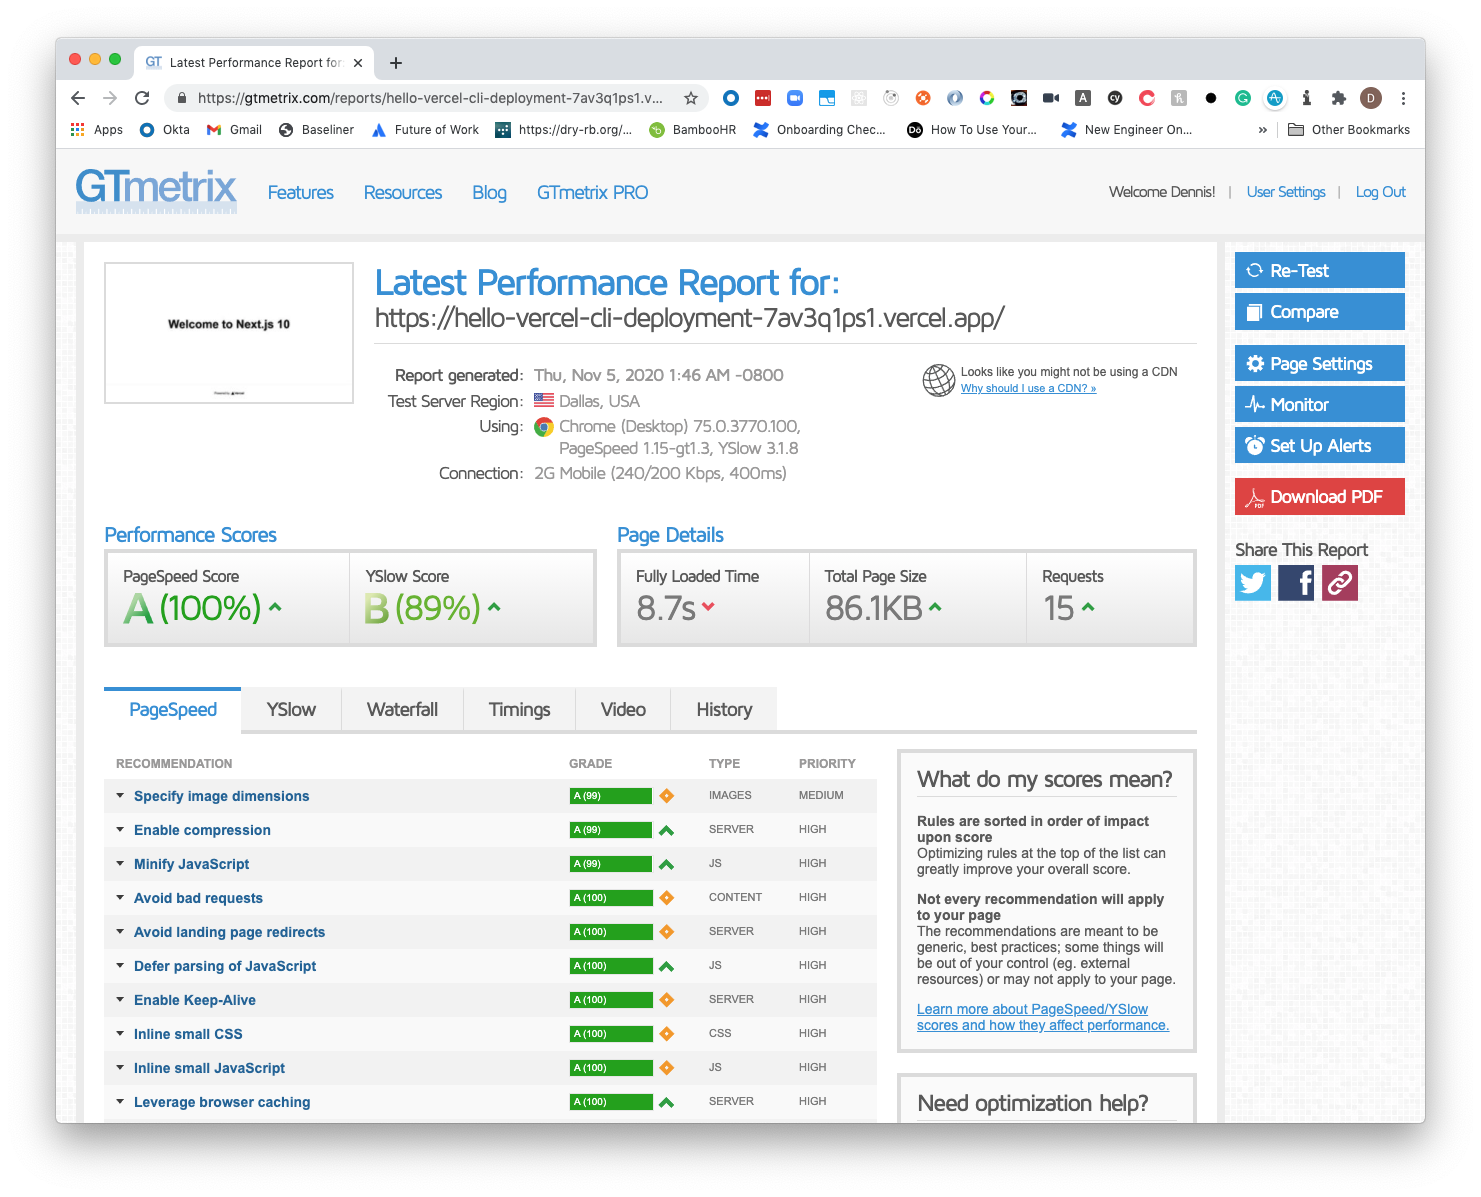
I created an account with GTMetrix and at the top of the home page, you can simply copy and paste in the URL of your Vercel app's website and start tinkering with settings.

GTMetrix Dashboard
I fiddled with the settings and made a number of manual calls to the app with different locations and settings - you can see some of the throttled results below:

GTMetrix
GTMetrix Slowest
After doing a number of these visits, I decided to call it a night and play the waiting game.
Viewing the analytics
Coming back to my Vercel dashboard in the morning, we had some data points to see in action!
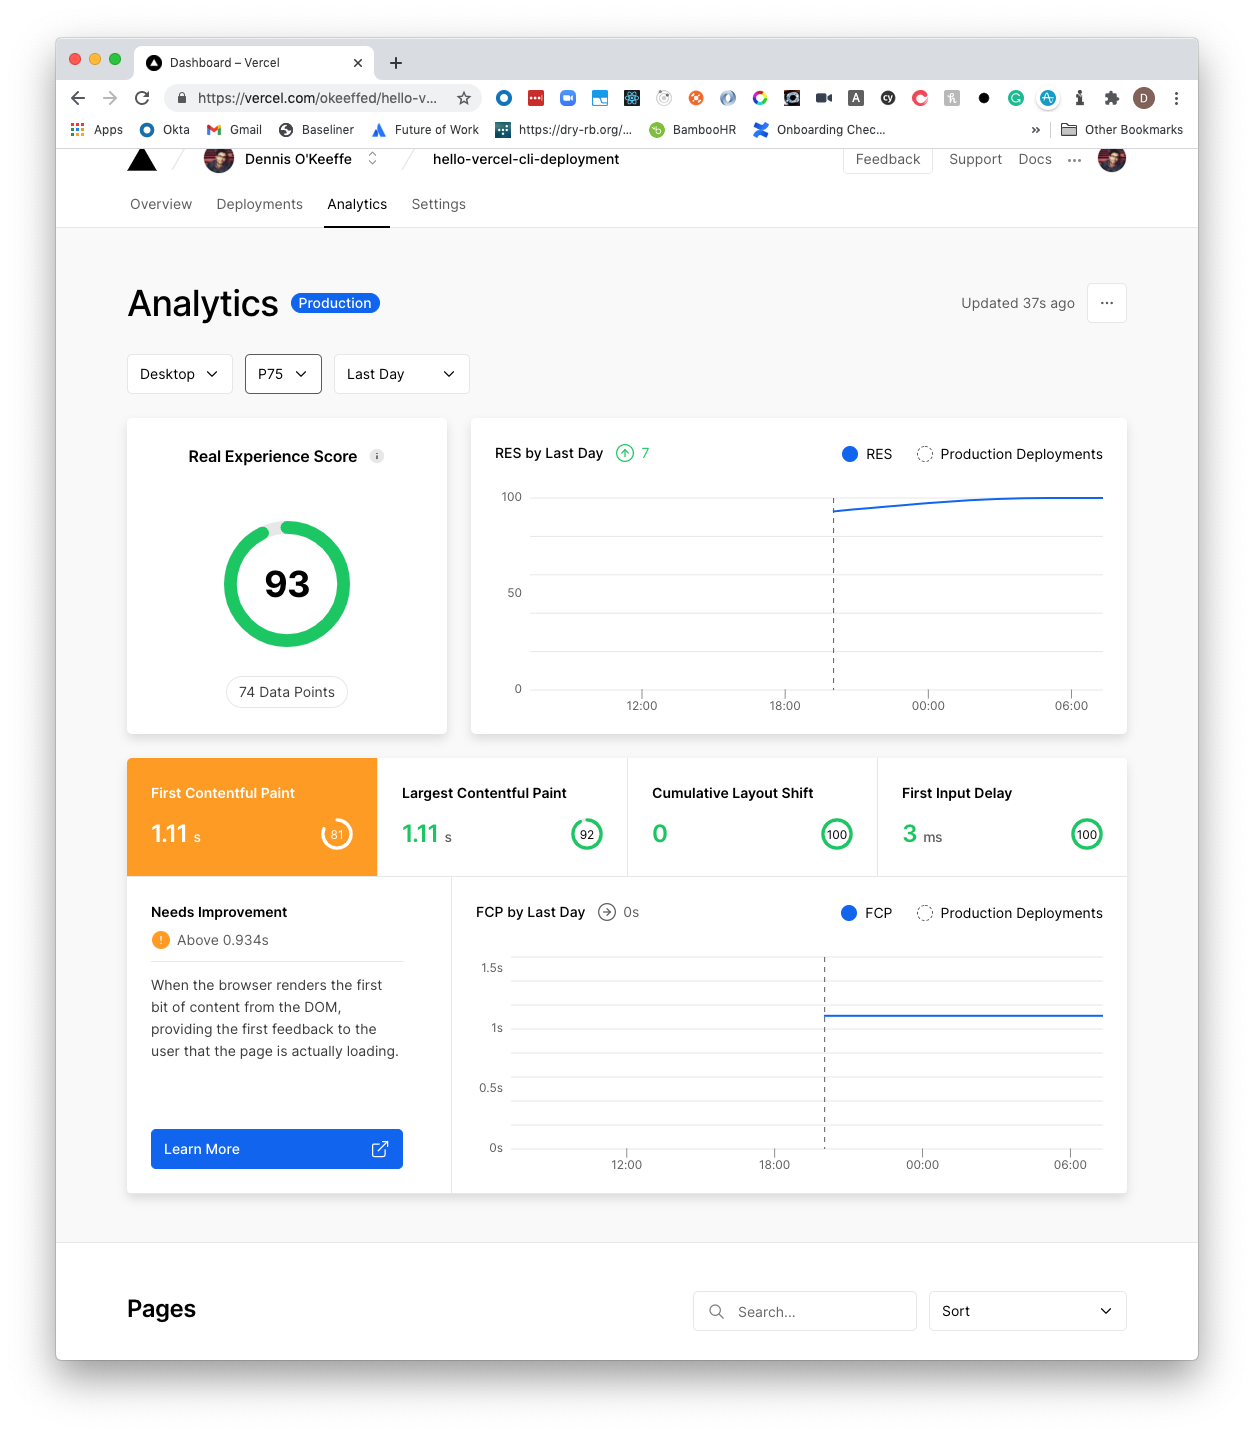
Vercel Analytics 75th percentile

Vercel Analytics 90th percentile

Vercel Analytics 95th percentile
Amazing! We have lift-off!
While I will let the official overview do the talking as to what each metric refers to, I will explain the p75/p90/p95 screenshots that I shared above by quoting a nice excerpt from a DataDog blog post (which in turn quotes Site Reliability Engineering):
"Using percentiles for indicators allows you to consider the shape of the distribution and its differing attributes: a high-order percentile, such as the 99th or 99.9th, shows you a plausible worst-case value while using the 50th percentile (also known as the median) emphasizes the typical case"
I am going to copy the image address from the DataDog post, so hopefully, the address lasts the test of time to give you great visuals on what this means:
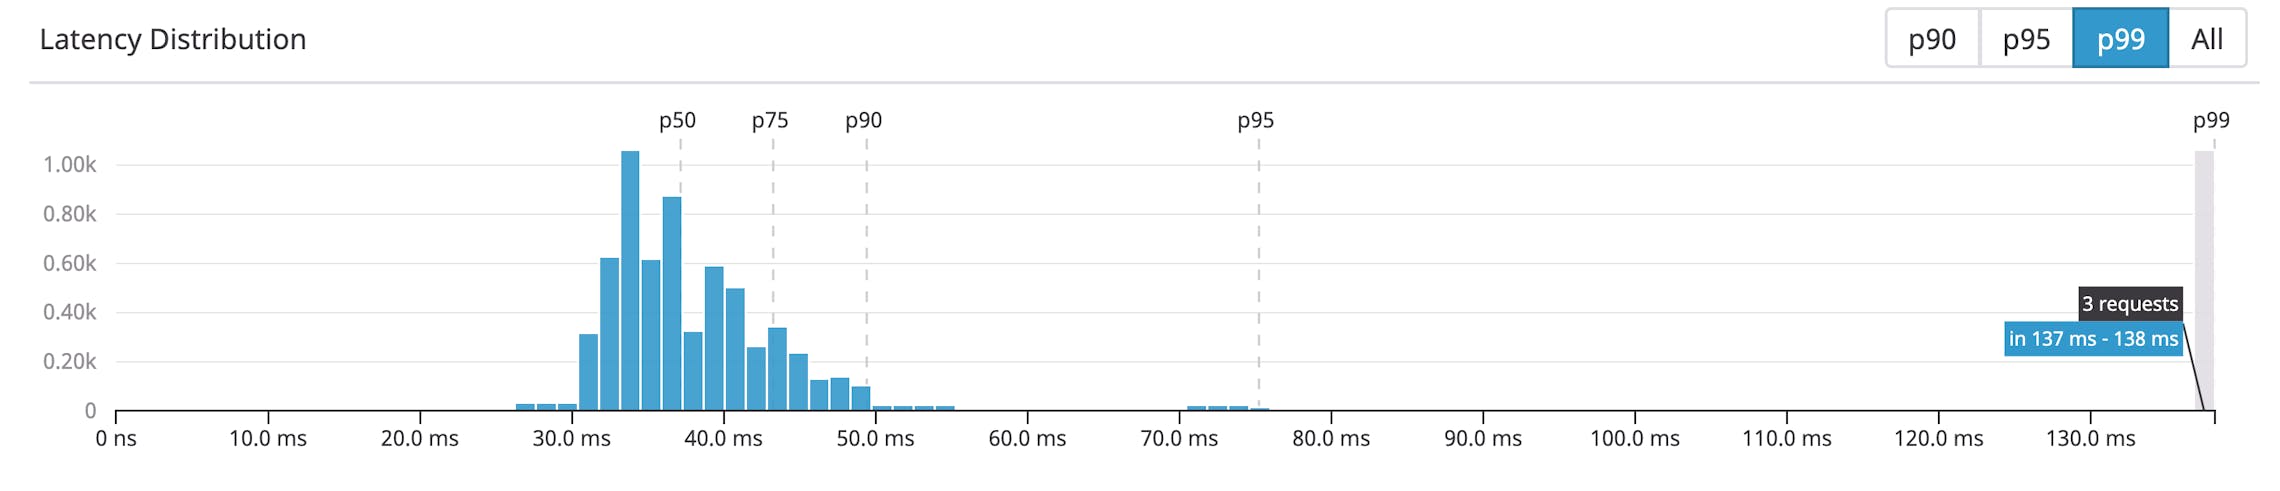
Percentiles Visualised
In the above image, you can see p99 deals with the worst outliers while p50 gives a better look at your typical user.
The same applies to the analytics you have seen on my dashboard. The p75 metrics will show the plausible worst-case scenario for that user, again for the p90 and lastly the p95.
The ability to filter down these percentiles, even on the hobby tier is extremely valuable to getting metrics and insight from real-world users! It will empower you to make the best decisions on what you should or shouldn't focus on based on your demographic.
In conclusion
Today's post looked at setting up Vercel Analytics with a Next.js 10 project, followed by emulating some real-world metrics though a page-speed service and finally a high-level look at what data comes back.
Vercel (and formerly as Zeit) have been building some badass tools and services for years and their platform is top-notch.
Be sure to check back as I delve further into some of the new options that Vercel and Next.js 10 provide in upcoming posts.
Resources and further reading
Image credit: National Cancer Institute
Originally posted on my blog. Follow me on Twitter for more hidden gems @dennisokeeffe92.


Dennis O'Keeffe
Melbourne, Australia
1,200+ PEOPLE ALREADY JOINED ❤️️
Get fresh posts + news direct to your inbox.
No spam. We only send you relevant content.
Exploring Vercel Analytics Using Next.js 10 and GTMetrix
Introduction
